What evidence leads to and supports
the Big Bang model? A good review of the resulting expansion (and calculated
rates) and ages derived from these observations can be found in a Scientific
American article (October, 1998; pp. 92-96) prepared by Dr. Wendy L. Freedman.
Two accepted lines of proof for the
Big Bang have already been described: 1) the details of the creation physics and
progressive emergence of various elementary particles during the first minute of
the Big Bang (the Standard Model and its variants; review page page 20-1) are consistent
with a model based on Big Bang precepts; these particles are the outcome of a
history that can be predicted and explained by Quantum and High Energy Physics,
that is, the theoretical production and sequence of particles seems verified by
the observed amounts of H, He, and Li atoms in the Universe; and 2) the
observations, particularly from HST, of the farthest galaxies as being more
primitive in appearance and development, are precisely what is expected from the
expansion model in which those parts of space (in which the galaxies are
embedded) that have moved the fastest are now the most distant; thus, we see
them in earlier stages of evolution when they were younger as we look back in
time outwards from our frame of reference,.
But, even more convincing are two
other physical observations that are best explained by a Big Bang origin for the
Universe, especially in terms of its expansion behavior: redshifts of
light (towards longer wavelengths) from the stars as a composite source in
galaxies and cosmic background radiation.
The first derives from relative
velocities as divulged by the measured redshift of radiation
wavelengths (see below for details). This was formalized by V.M. Slipher in 1912
but, in fact, H. Robertson noticed a bit earlier that the farther nearby
galaxies were from our telescopes, the greater was the redshift. However, Edwin
Hubble in 1924 has received credit for promulgating this
redshift-velocity-distance relationship because he included many more galaxies
as data points. He thus is recognized as the key individual behind the Expanding
Universe model, from whence later came the Big Bang conception of its origin.
(Note: Hubble himself never completely accepted the implications of his
observations and had doubts about the Big Bang and most of the Universe models
described below; for many years after drawing attention to this phenomenon he
continued to prefer a Steady State rather than an Expanding Universe, although
his position on the latter "mellowed" near the end of his life.)
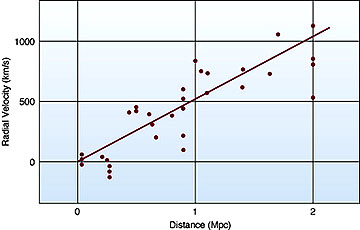
Some of Hubble's observed redshifts
led to estimates of galaxy velocities of 100 million kph, about 0.1 the speed of
light. Here is a plot of his original data, from which he deduced the expansion
concept that later led to the Big Bang model
Hubble noted that, as recessional
velocities Vr were measured for stellar sources over a wide range of
astronomical distances D, the plot of Vr/D disclosed a straight line
relation whose slope has a value H, known as the Hubble Constant, named
after him. This, the Hubble Law, is the fundamental statement of the Big
Bang model. Here is one of his published plots of velocity versus distance.
The resulting straight line plot is
easily described mathematically, in the basic equation:
The constant has been designated by
the letter H, and is called the Hubble Constant. It is normally given the units
of Km/sec/Megaparsec (an alternate form is km/sec/million light years). The
prime information derived from this equation is that objects (such as
galaxies) appear to travel at ever increasing velocities as their distance from
the observer (Earth) becomes ever greater. The upper limit to expansion rate
is the speed of light (although some interpretations of inflation suggest that
this huge leap in dimensional enlargement occurred at greater than light speed).
The current rate of expansion is specified as one light year per Earth year
(think about this and its logic should be revealed).
One problem troubling Hubble in the
early years after his discovery is that when he used the first value for H he
derived to calculate the age of the Universe, it came out around 2+ billion
years, a number in stark conflict with the then accepted age of the Earth at
about 4 billion years. The contradiction resulted from very imperfect - and too
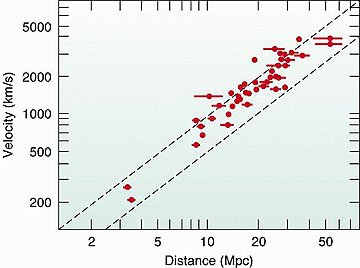
small - estimates of distance to the nearby galaxies he used. As more
trustworthy values were obtained, and elliptical galaxies further out were
better fixed as to distance, an improved curve resulted (but still applicable to
redshift z values [see below] of less than 1):
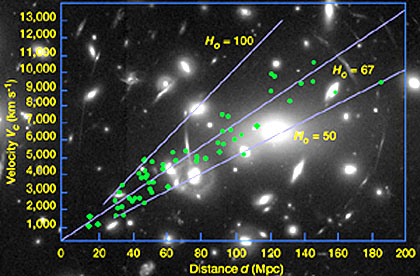
The diagram below is a recent plot
of galaxy velocity (in km/sec; converted to kph by multiplying by 3600) versus
distance (in megaparsecs) of each galaxy from Earth; the green dots denote
specific galaxies for which "reasonably good" measurements have been made (other
galaxies have also been so measured but their values are not on this diagram).
Most of these values come from galaxies 5 billion or less light years away.
H0 is the present-day Hubble Constant whose precise value is still a
major goal in cosmological research; its spread of estimates is related to the
uncertainties both in determining the redshift and in fixing the distance of a
galaxy at the time light now received left it.
The Hubble Law works best (gives a
straight line) from plots of V versus D involving galaxies a few billion or less
light years away; uncertainties as to the correctness of distances further out
cause an increasing scatter of points in the plot that suggest (or mask) some
degree of non-linearity related to the cumulative effects of the curvature of
space.
Although called a "constant", H has
in fact varied in value over time. In this, it behaves much like the three
non-linear plots of R (Scale Factor) versus time shown on the previous page. R
describes how distances (as a measured parameter) change over time; H relates
distance traveled in a unit time span at each distance moving outward from the
point of observation. The two are related. H refers to the relative rate of
change of R. The reason that H has different values going back through the past
is that it is unlikely that the expansion rate of the Universe has itself been
constant since the Big Bang. Until recently, one model of expansion is strongly
influenced by deceleration due to gravitational forces pulling back on the
enlarging universe, which means the rate of expansion has been continually
decreasing, giving rise to a systematically changing H over the past (its value
would increase as we move back in time towards the outer Universe). But now, new
evidence for a gradual acceleration about midtime in the Universe's history (see
next page) would also affect the variability of H. At best, we can now only
determine with reasonable accuracy the value of H0, which proxies for
the current value that takes into account the variations in earlier eons of the
Universe. We can also say that H was at its maximum value relative to the
present right after the extremely large (anomalous) expansion rate of Inflation;
we cannot measure this value since we are unable to determine any redshifts
until the Universe became transparent.
Let us now look into the details of
the concept of "redshift". Increases in recessional velocities are associated
with changes in the wavelength of light being received, such that as the
velocity becomes greater the wavelength becomes longer, i.e, moves to higher
values (say, from 0.4 to 0.6 µm in the visible; wavelengths in other regions of
the EM spectrum also are shifted towards greater values). This change is very
much like the Doppler effect studied in Introductory Physics: this shows the
influence of motion towards or away from the observer of a signal of some given
wavelength, resulting in a systematic wavelength shift. One manifestation of a
wavelength shift's effect, which can be experienced in everyday life on Earth,
is exemplified by an audible phenomenon - recall the sound of a whistle or horn
on a fast-moving train as it approaches and then moves past where you are
stopped at a crossing. The pitch of the sound varies systematically, rising on
approach (higher frequencies) and then falling as the train recedes after
passing (lower frequencies). This wavelength shortening (higher pitch) on
approach and lengthening (lower pitch) with recession is called the Doppler
effect, which results from velocity and/or position changes (relative
motions) between moving source and stationary receiver.
In a sense, the lengthening of
wavelength as light sources (mostly galaxies) recede from Earth at progressively
increasing velocities and distances is analogous to the above Doppler effect.
Strictly speaking, this familiar effect as observed by us on Earth is not the
same as applies to cosmic distances (although it is a good approximation for
nearby galaxies in relative motion away from our observing location). As applied
to more distant objects seemingly moving away from us during Universe expansion,
the wavelength shift actually results from a different mechanism known as the
Cosmological Redshift. From a relativistic standpoint, while Dopplerlike
in its consequences, the cosmological redshift is analogous to the "stretching"
of light caused by the progressive increases in distance resulting from the
continuous expansion of (curving) space. This in turn results in
proportional increases in recessional velocities (thus in the formula for
velocity v = d/t, it is the d that changes with respect to steady time
progression) with increasing distance from Earth (recall the rubber band analogy
on page 20-8).
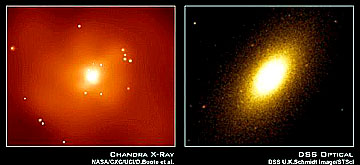
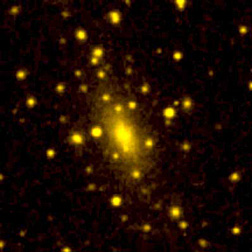
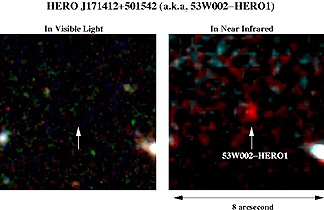
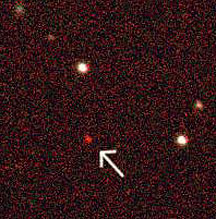
A recently reported observation of
a type of galactic body called a HERO (Hyper Extremely Red Object) may be the
result of this cosmological redshift. Check these two images:
On the left, the object is not
detected in visible light; but it appears as a red blotch in the near infrared.
The object, at least 10 billion light years from Earth, has been found to be
speeding away from us at nearly the speed of light. One interpretation considers
this object to be red (from a large propoortion of older stars) at the time its
light left the source 10 b.y. ago . But another considers this this object to be
composed in large part of bright, bluish stars, perhaps even farther away (13
billion l.y.) but owing to the cosmological redshift the light as received has
been stretched to near infrared wavelengths (but assigned red in this false
color rendition). Redshift phenomena are effectively
studied from their spectral states. As a star or galaxy emitting radiation
recedes from an observing (measuring) spectrometer (somewhere on or near the
Earth), the wavelength associated with a particular line will be shifted towards
the red (longer wavelength-lower energy end of the visible spectrum) and even
into the near infrared. What is measured is the displacement (δλ/λ = the
incremental wavelength shift ratioed to its initial wavelength λ) of this line
to a new apparent wavelength relative to its [rest state] wavelength in a
spectrum obtained by exciting the element on Earth in an emission or absorption
spectrometer. The spectra are commonly recorded on a photographic plate showing
multiple lines that result from the spectral spread of wavelengths
characteristic of all detected elements) representing an element in its ground
or some excited state in the visible.
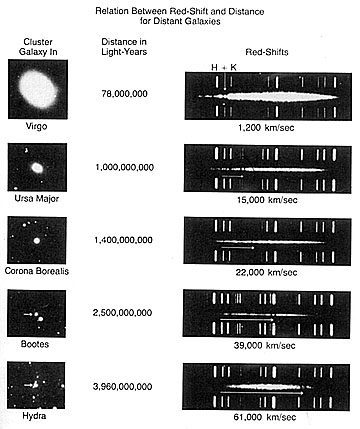
This next illustration shows
telescope images and spectra from five galaxies at increasing distances from
Earth.
To pick out and thus intrepret
these spectra, start with the Virgo galaxy example (top right). The top and
bottom lines are the same emission spectra for this spectral interval
(unspecified; they are white instead of black because the photographic plate is
printed as a negative) obtained by spectroscopic analysis of a sample on Earth.
The two leftmost lines are the H and K spectra for the excited Ca++
state. The spectrum from the galaxy appears as a long lenticular white smear in
between the two reference spectra. The vertical arrow points to the now shifted
H and K line pair, which here appear black because they are absorption rather
than emission lines. In the second spectral image, the horizontal arrow leads to
the position of the line pair for a galaxy in Ursa Major, now shifted notably to
the right. In the three succeeding spectal images, the horizontal arrow carries
to the position of the two dark H and K lines after each greater redshift. From
these observed shifts, the recessional velocities listed under each spectral
image have been calculated. These could be plotted on the distance-recessional
velocity diagram above, and would fall within the general distribution shown
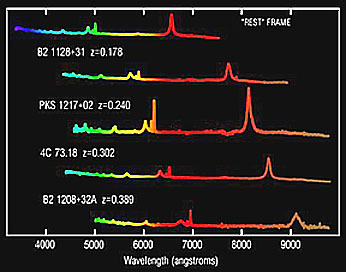
thereon. Today, the spectra are more
commonly recorded as continuous tracings on a strip chart. The next figure shows
a spectrogram recorded by a Kitt Peak National Observatory telescope in which
the top spectrum (obtained at rest in the laboratory) has peaks for three
hydrogen lines at 4340 A (in the blue); 4860 A (green) and 6552 A (red). The
next four are spectra from distant quasars at progressively greater distances.
The displacement of a spectral line
owing to redshift can be used to calculate the redshift value z
associated with a source simply from the rest wavelength of a given line
and the observed wavelength of the same line displaced by the source's
motion: The formula:
Using the z value, the
velocity v of receding motion of the source is given by:
Since the redshift is velocity
dependent, its magnitude is a direct indication of the rate of recession, i.e.,
the larger the shift, the greater the velocity. The redshift z is a number that
represents the fraction by which spectral lines from a luminous source shift
towards longer wavelengths. Values of z range from less than one for closer
sources and have risen for the most distant sources (early time galaxies) to
numbers around 6. If instead the source advances
towards the observer, the shift will be towards the blue (shorter wavelengths).
Since it is postulated in the Big Bang model that all sources are apparently
moving away from one another, a blueshift would seem anomalous. However,
this occurs, for example, when spectra are acquired from a rotating spiral
galaxy in which arms on one side (from the center) may indeed be moving away but
the other side must be approaching from opposite directions. Likewise, some
galaxies in a local group may appear to be moving towards Earth towards Earth,
but the entire group is still receding relative to our galaxy.
Another mechanism can cause
redshifts, namely, the effects of gravity on radiation. This gravitational
redshift is a consequence of General Relativity. When light leaves a massive
gravitational source, such as a White Dwarf, gravity causes a shift towards a
longer wavelength (conversely, light passing into a huge gravitational field
will undergo a blueshift). The massive body thus slows down photons representing
a range of energies as these escape from it, causing a loss in their energies
that results in reducing their frequencies and increasing their wavelengths This
effect has been observed for light grazing supermassive bodies, including Black
Holes. Overall, the effect is localized or confined to individual bodies,
and normally the shift is very small, so that even the cumulative effects of
light reach Earth from the outermost reaches of Space are quite small compared
with the motion-induced Cosmological Redshifts related to expansion.
Nevertheless this local redshift must be accounted for when individual receding
galaxies are used in determining the cosmological-scale redshifts.
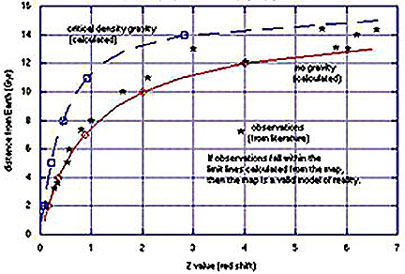
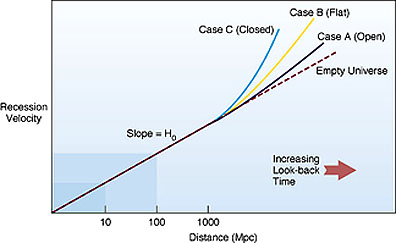
There is another, more general
effect of gravity, shown in the plot below, which shows the redshift curve for a
Universe with maximum gravity influence versus no gravity at all. This range of
possibilities is pertinent to the accelerating Universe model discussed on the
next page.
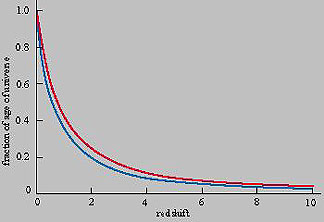
A variant of this is shown in this
figure:
The ordinate denotes relative age:
At this time, that can be given by "1", with those nearby galaxies that appear
most fully evolved (to the present time) having very low redshifts. The
exponental drop in the curves (the red curve applies to a Universe with 70% Dark
Matter; the blue curve described a Universe without Dark Energy [Cosmological
Constant = 0) shows that the maximum rate of increase in the value of 'z'
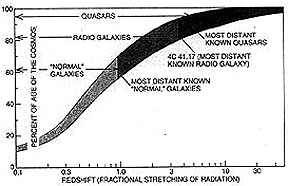
occurred when the Universe was less than a relative 0.2. Most redshifts measured so far
include the lower values of z obtained by examining a range of "normal" galaxies
at distances from Earth under about 7 billion light years. Higher redshifts have
been found for galaxies that are strong radio sources and even larger values
(around z = 5 to 6.5) from very distant quasars (mainly those which display
their effects in the first two billion years of Universe history). Values of 'z'
increase rapidly towards infinity for Universe events older than the first
stars. For instance, at the time of Recombination (page 20-1) z = 1000. This is
the general relationship as tied to major cosmological entities:
To apply the redshift to estimate R
(Scale Factor), and to determine the Hubble contant H, the distances to the
shifting bodies must be specified. Distance measurements obtained for nearby
bodies, e.g., in our own Milky Way galaxy, can be made on visible stars whose
magnitudes can be directly ascertained. One technique is that of parallax
observations. While not fully explained here, the gist of this technique can be
sensed by this simple experiment: Hold your index finger first about 6 inches in
front of your nose and rapidly alternately close your left eye and then right
one repeatedly. Your finger will appear to shift back and forth relative to a
fixed background, perhaps seeming to displace several inches. Now, put your
finger full out (about 24 inches) and do the same thing. Note that the
displacement is now less. This is the parallax effect. The amount of shift
decreases with increasing distance and that distance can be determined by simple
trigonometry. As used to measure stars within about 100 parsecs (326 light
years), the left and right eye positions are proxied by the positions at
opposite points in the Earth's elliptical orbit six months apart. A star's
apparent shift relative to distant background stars, even though proportionately
much smaller than that of the finger experiment, is sufficient to provide an
accurate distance measure for stellar bodies close to Earth.
Redshift measurements for more
distant starlike bodies are actually made on galaxies (their individual stars
may not be resolvable) whose luminosities are the average of all component
stars. Approximate distances to much closer host galaxies containing separable
stars rely on determining the intrinsic luminosity of certain types of
individual stars. One class is the so-called pulsating stars, i.e., those whose
luminosities vary systematically over periods of days to several months. These
include stars that have used up nearly all of their hydrogen fuel and are
enroute off the Main Sequence towards then becoming Red supergiants. During this
phase of their history, their atmospheres expand rapidly with a rise in
luminosity, only to revert back to their previous state during a cycle whose
time is that of a regular period. What happens is this: the star in its more
compact state has a specific internal pressure; at some point the nuclear
processes cause the star to expand, increasing its diameter by a factor around
2. The pressure gradient decreases until a condition is reached in which gravity
now reverses the process causing contraction. The expansion-contraction repeats
at its characteristic, nearly constant time period (in Earth days) for a long
time before a particular pulsating star evolves into a more stable Red
(Super)Giant. Most stars showing this phenomenon have initial masses from 5 to
20 times that of the Sun. More massive stars have longer periods of
expansion-contraction and are also more luminous to start with.
One class of periodically pulsing
star group are the RR-Lyrae stars whose periods are in hours to a single day.
More important are the Cepheid supergiant stars. Cepheids were first
discovered by astronomer Henrietta Leavitt in 1912 in the nearby Magellanic
Clouds; she then showed them to have regular, pulsating variations in luminosity
proportional to their pulse periods (in so doing, determined that the brighter
the star, the longer its period P). Cepheids flare up to peak
brightnesses, then dim down, over periods of days to weeks. Using the parallax
method, the distances to some of these were independently fixed and their
absolute magnitudes M were calculated. Since these distances varied
(within the Milky Way and in the Magellanic Clouds), the various M values could
be associated with their corresponding periods in the cycle, thus establishing
the M-P relationship. Of course, Cepheids having the same values of M but
located at widely varying distances from Earth will experience an apparent
decrease in brightness m depending on distance (and subject to the
1/d2 relation that defines the falloff in brightness with distance).
These ideas are illustrated for one of the type Cepheids (δ-Cephei).
Once absolute luminosity for a
given Cepheid is calibrated from this relation, the drop in apparent (observed)
brightness m from that value owing to its specific distance d can
then be included in the following equation to determine that distance to this
star:
In the 1920s, Edwin Hubble more
firmly established the relation that the longer the period, the greater is the
increase in the intrinsic (absolute) brightness in a Cepheid. He applied this
pulse cycle approach to these stars in different galaxies and over a range of
distances. It was Hubble's use of primarily Cepheid-derived distances that led
to his first major hypothesis of an expanding Universe, after also introducing
the redshift relation. Some of the values he used were not highly accurate (but
were later corrected) so that his initial postulated rates of expansion were
considerably off-the-mark. The Cepheid variable star method
works well out to a distance of 50 million light years (roughly, out to Virgo).
For galaxies farther away, other methods of measuring distances to them (such as
the rich cluster- brightest galaxy indicator which gives usable approximations
out to 10 billion l.y.) have been worked out and applied (they have varying
degrees of accuracy. Use of multiple methods applicable at different distances
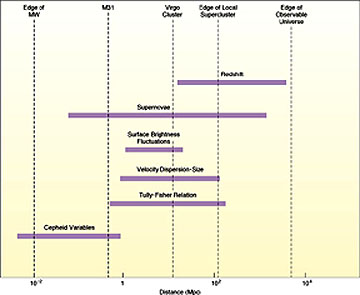
is called the Cosmic Distance Ladder. To sum up: Among these methods are
(in order of usefulness at increasing distances: 1) Parallax; 2) Moving Cluster;
3) Color-Magnitude; 4) Period-Luminosity (Cepheids); 5) Supernovae. This diagram
shows several of these and some other methods; the abscissa in the chart is in
units of Megaparsecs. A good, in-depth review of the principal methods used in
distance determination is found at Ned Wrights Cosmology
site.
The Cosmological Redshift z
is given as: z = (
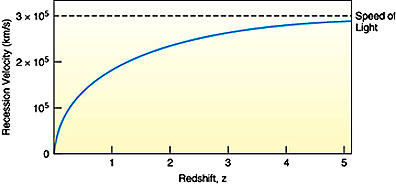
When redshifts begin to exceed
about 1, the speeds of the objects concerned begin to approach relativistic
values, i.e., they are ever larger fractions of the speed of light. Thus,
although the actual speeds continue to increase, the incremental rate of
velocity increase itself decreases (slope asymptote approaches 0). This gives
rise to a redshift vs recessional speed curve that is like this:
Another relationship: z =
1/R(tem) - 1 describes the redshift in terms of the Scale Factor R
pertinent to tem which refers to the particular time when the light
was emitted . This relationship can also be cast in the following way: Redshift and the Hubble Law
 From Astronomica.org
Vr (velocity of recession) = H (the constant
determining slope) x D (distance [from observer])
From Astronomica.org
Vr (velocity of recession) = H (the constant
determining slope) x D (distance [from observer])
 From Astronomica.org
 From J. Silk, The Big Bang, 2nd Ed.
 Source: M. Corbin
z = (λobs/λrest) - 1
v = cz (1 + 0.5z)/(1 + z)
Source: M. Corbin
z = (λobs/λrest) - 1
v = cz (1 + 0.5z)/(1 + z)
 Stellar and Galactic Distances (from
Earth)
Stellar and Galactic Distances (from
Earth)
 m - M = 5(log d/10)
 From Astronomica.org
![]() rec -
rec - ![]() em)/
em)/![]() em = Vr/c, where
em = Vr/c, where ![]() em is the wavelength given out in the past (then) at the
emitting galaxy or star,
em is the wavelength given out in the past (then) at the
emitting galaxy or star, ![]() rec is the shifted wavelength received today (now) at
the detector (on Earth), Vr is the recessional velocity for the
particular redshift, and c is the speed of light. (The above equation applies to
low to moderate z's but for large z's, which are attained as the velocities near
that of light speed (and are characteristics of the early moments of the
Universe) a modified expression must be used:
z + 1 = (1 + v/c)/(1 +
v2/c2)1/2
rec is the shifted wavelength received today (now) at
the detector (on Earth), Vr is the recessional velocity for the
particular redshift, and c is the speed of light. (The above equation applies to
low to moderate z's but for large z's, which are attained as the velocities near
that of light speed (and are characteristics of the early moments of the
Universe) a modified expression must be used:
z + 1 = (1 + v/c)/(1 +
v2/c2)1/2
 From Astronomica.com
in which Dnow is the
distance to the emitter when the light is received and Dthen refers
to the distance in the past when light left the emitter.
We see a redshift (towards longer
wavelengths) because the Universe had a different Scale Factor when the light
left the emitter. The redshift is due to the relative expansion of space
(increasing "D's" [for distance]) rather than actual speeding up of more distant
galaxies. Look at the two circle drawing shown earlier on page 20-8. Note the S-like
curl that represents part of a wavelength train. It has a shorter wavelength in
the left circle; as the circle expands with its enlarged coordinates, note that
the wavelength on the right is now longer.
Before new data from the HST and
other observing systems, the present-day value of H (i.e., H0) had
fallen to between 50 to 100 km/sec/Megaparsecs (a parsec is 3.26 l.y). (In some
expressions of H, megaparsecs are replaced by 1 million (106) light
years; thus 75 km/sec/Mpc = 23 km/sec/106 l.y.) One goal of the
Hubble Telescope is to better zero in on the most accurate value of H -
essential to an accurate estimate of the Universe's age. From most recent best
estimates, a range of H0 (value at the present time) between 65 and
79 km/sec/Mpc is considered the most likely to contain the eventual most
accurate value (still being sought).
The general relation for the
Universe's age (since the Big Bang) is given by the expression: t0 =
1/H0. In the actual calculations, when H units (in the Mpc mode) are
adjusted to give an answer in billions of years, the formula becomes: Age =
977.8/H0. For an H0 of 65 km/sec/Mpc, the formula gives an
age of 15.04 billion years (estimated uncertainty is +/- 2 billion years).
Currently, 13.5 billion years (H0 = 72.5 km/sec/Mpc) is the most
widely accepted value (ages between 14 and 15 billion years are also quoted in
papers published in the last few years). The lower the value of H, the larger is
t0 and thus the Universe becomes older.
The formula t0 =
1/H0 is deceptively simple. Just putting in a value for H0
yields a number that is not years as such. The proper units must be included.
Here we will run through the calculation that leads to the end-result age for a
value of H0 = 70 km/s/Mpc (s = sec; Mpc must be converted into
mega-light years):
(Note: / denotes values to
its right are in the denominator of that term; X is the multiplier sign
between terms.)
However, the Hubble Age also
depends on whether the Universe is open, closed, or flat, and may be influenced
by the type of space involved (see below). In the absence of gravity the value
of tH is 1/H0. The Hubble age for a Universe with flat
expansion varies as the relation tH = 0.67/H0 (this
applies to the Einstein-DeSitter Universe [see below]). For an open Universe,
tH falls between 1 and 0.67. For a closed Universe, tH can
be less than 0.67. These several cases for ages that are less than 1/H seemingly
point to Universes that began less than ~14 billion years ago. But, if the ages
of the most distant galaxies, now only estimated from distance-brightness
relations, prove to be around that value, then the resulting paradox - parts are
older than the whole - will need to be explained away. To some extent, resolving
this paradox can help to specify the type of Universe that actually exists,
since age-incompatible situations would seem to argue against the types that
don't fit.
Over the past 5 years,
observational data analyzed by HST Teams whose prime task is to try to pin down
the Universe's age using a better determined Hubble constant suggested in May of
1999 a best estimate for the Hubble constant of 70 km/sec/Mpc. (That number also
coincides with the local expansion rate based on redshift-distance measurements
for galaxies near the Milky Way.) For the H range they arrived at, an age of 12
to 13.5 billion years would result. The age uncertainty represents an accuracy
variation to within +/- 10% for the value of this constant. Their value depends
on analysis of redshifts in 18 galaxies within 67 million l.y. from Earth; in
these they have found up to 800 Cepheid variable stars which are the most
reliable indicators of large distances. From the combined determinations for the
18 galaxies, this best estimate of expansion rate gives an increase in velocity
of 256,000 km/hr (160,000 mph) for every 3.3 million l.y. farther out the
stellar entity (galaxy or individual stars) is from Earth.
Most astronomers disputed the above
age conclusion based on the galaxy distance model, citing older ages according
to their calculations and their interpretation of H values using different
inputs. In the last few years most cosmologists (e.g., Alan Sandage and
associates) are advocating a value of H that yields an age closer to 14
Ga; this recent age is now the preferred "best estimate". However, a vital
note of caution: As more galaxies at great distances from Earth are detected and
measured astrometrically, so that their intrinsic brightnesses, distances, and
redshifts are known with notable accuracy, the value of H could be recalculated
to a lower number. This would mean an older Universe (greater than 14 Ga) and
would mean that the oldest galaxies now known lie well within the limits of the
knowable Cosmos. Said another way: there may be considerably more space beyond
our present observable Universe, that is where our time horizon now extends, and
this additional outer volume would likely contain galaxies. This can be assessed
when/if we can see the outermost, already detected galaxies in such detail that
we can specify how primitive or early they are in their evolution. If they
appear to be in the first stages of formation, if we know enough about their
rates of growth, and if galaxies indeed to form within the first billion years
after the Big Bang, then these galaxies are probably near the edge of the
expanding Universe, with little or no space beyond. This does not rule out an
infinite Universe, if it is destined to continue expanding into an infinite
future.
The first reported (before 1995)
HST-derived ages fell between 8-12 Ga, anomalously low compared with pre-Hubble
reported ranges of 12 - 18 Ga. This was especially confusing in that separate
evidence and theoretical calculations indicate some distant galaxies might well
be 13 Ga and possibly older. This Age Paradox - stars seemingly older than the
Big Bang's start time - proved particularly troubling to cosmological theorists
for several years. The problem was minimized with further studies of nearby
globular clusters which contain very old stars. These clusters formed along with
the organization of the oldest galaxies around which the clusters are tied by
gravity within the galactic halos. Data from the Hipparcos astronomical
satellite led to a redetermination of globular cluster luminosities, and
correlative rates of fuel consumption. From this new information the average
ages of clusters was reduced by 14% so that their oldest stars (Red Giants)
could not be older than the 13 Ga cited above. This, together with the more
refined 13-14 billion year Hubble age (see below), obviates the discrepancy
posed by the Paradox. One consequence of this most recent age estimate is that
the farthest galaxies whose distances from Earth is said to be 13 billion l.y. -
one has now been found at 13.23 , and in time more will be detected that are
even farther away (older) (page 20-8) - must lie near
the observable edge of the Universe.
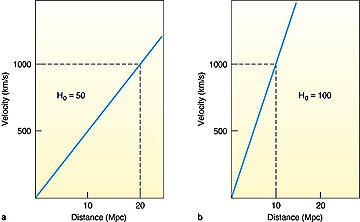
Thus, from the above, variations in
the chosen value for H0 have a major, definitive influence on two
fundamental cosmological parameters that scientists seek to know "exactly" - the
size of the observable Universe and the age of the Universe. This notion is
brought home by considering the consequences of changing the H0
value, as is done in this figure:
The question to ask in interpreting
these H curves is which one leads to a younger Universe; which Universe is
smaller? Check the conclusion by clicking on this *. The critical factors determining
the Universe's age are its overall density (mass and energy) and the value of
the Deceleration Parameter (related to the Hubble Scale Factor), as discussed
elsewhere on this page. These specify the rate of expansion which in turn
reveals how long it takes for galaxies to get to the farthest reaches of
observable space (i.e., the limits or horizon defined as the farthest
bodies that have emitted radiation which has had time since the beginning of the
Universe to travel to Earth's observing stations; this will be marked by the
first vestiges of materials capable of emitting detectable radiation during the
early moments of the Big Bang; so far, detectors covering optical and other
spectral regions have not yet picked out these oldest sources, so the currently
observable Universe presently is smaller than the total observable Universe).
The Hubble equation specifies that
the fastest receding objects must be farthest away; conversely, those near the
Milky Way are the slowest moving. Thus, in an expanding Universe, with all
galaxies ultimately drawing apart from each other, those progressively farther
away must travel at proportionately greater speeds, but at the same rates in all
directions, to preserve an overall uniformity of spatial relations during these
expansive movements. As a general rule, the greater the lookback time,
the smaller was the size of the Universe at such times, and the hotter and
denser is the early expansion status of matter and energy. (Lookback time
connotes the idea that the farther out in space one looks, the further back in
time [earlier] is the event or stage of development associated with objects
[e.g., galaxies] when light left them; a large Lookback time means a younger
age]).
Because most galactic measurements
made on distant galaxies show red rather than blue shifts (the latter are seen
for mostly nearby galaxies moving towards us [Andromeda is approaching Earth at
~360,000 kph] or can be noted in individual spiral galaxies as one arm moves
towards Earth), this evidence for overall (net) recession is the principal proof
for the Big Bang expansion model. The redshift is related to recessional
velocities (ratioed with respect to the speed of light) by an exponential
curve in which the velocities rise rapidly towards infinity as that speed in
approached. Most measurements of z from less distant galaxies afford numbers
between 0 and 1 (for example, z = 0.1 represents a distance of about 1 billion
light years). Farther out galaxies showing redshifts of 1.2 correspond to ages
in light years of about 8 billion years; HST has now observed many galaxies with
z's up to 2+; distant quasars, some about 10-11 billion l.y away, have shifts of
3 - 4 or higher (at an observed age much earlier in Big Bang time). Several
galaxies have measured z values of 5-6 and one now has a value of z = ~10 (see
page A2a (reaching to about
90% of the speed of light); these are thus formed during the first billion years
of the Universe.
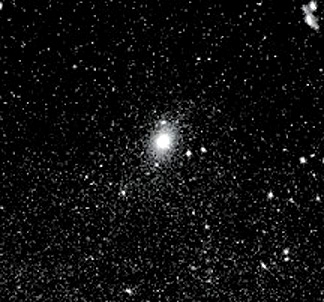
Here is an image obtained during
the Sloan Digital Sky Survey (SDSS) showing a galaxy with a redshift of 5.82
that is unusually bright (a quasar is inferred as the cause).
The time at which such large
sources of detectable luminosity is sometimes cited as the Friedmann
time, taken as the narrow time span when stars first formed and collected in
significant groupings. These often contain quasars that presumably grew from
young (protogalactic) gas clouds which at the time were emitting photons at an
observed temperature of ~3,000° K (referenced to an idealized blackbody - one
which completely absorbs incident radiation of all wavelengths and acts as a
perfect emitter; at that temperature, the wavelength signature peaks at ~1 µm,
however, at higher z values the actual blackbody temperatures can be much
higher, causing a peak in the ultraviolet).
Recessional velocities as a
function of distance of cluster galaxies from Earth as the observational
frame of reference can be calculated from the Hubble equation and z values.
Choosing a Hubble constant that gives 14 Ga as the age of the Universe, a galaxy
recedes an additional 25 km/sec for each million l.y. further out one looks
through space. For a cluster in the Virgo Constellation, at a distance of 78
million light years, the recessional velocity is ~ 1200 km/sec. For the Bootes
cluster, at 2.5 billion l.y., the velocity has increased to 22000 km/sec.
Galaxies whose distance is about 5 billion l.y., attain velocities approximately
one-third the speed of light (100000 km/sec). The most distant observed sources
(mainly quasars) reach recessional velocities approaching light speed. The same
type of velocity distribution would be ascertained at any other observational
point (such as set up by the distant galaxy "civilization" referred to earlier)
in the Universe.
As HST observations accumulate, it
is becoming evident that, with its resolving power, structure in galaxies can
still be recognized out to about 4 billion light years. Present evidence is that
beyond a z value of 2.75 no well-formed spiral galaxies can be confirmed to
exist (but at least some are likely). Those that lie farther out seem to be
ellipitical or commonly "dismorphous" (no regular form). Since these are older,
this implies that spiral galaxies may not develop until later in galactic
evolution. Some of the earlier-formed spirals have one or more extra arms
compared with younger ones (the Milky Way has 3 major ones).
The discussion in the above
paragraphs is confined to redshift measurements that can be made from observable
astronomical phenomena such as galaxies and quasars. There is another aspect
which is more theoretical, namely, the redshifts in the earlier history of the
Big Bang prior to the onset of the Decoupling Era (before which no direct
observations is possible). At the Planck Time of 10-43, the redshift
z is calculated to be 1032. After one minute - the beginning of the
Radiation Era, z drops to 109. In the first 1-2 billion years after
the B.B., the redshift decreases from about 30 to 6. The latter is near the
maximum value determined so far by direct measurements - the galaxies with that
value are about 13 billion l.y. away. This systematic decrease in
redshift accompanies the expansion of the Universe. The process of enlarging
space leads to a lengthening of the wavelength of light - hence the progressive
drop in the redshift value of z. Photons that have to travel greater distances,
from further out in the expanding Universe, appear to devreased energy - hence
longer wavelengths (Planck's Radiation Law), i.e., shifts from blue to red.
Since redshift also depends on the velocity of a receding object, it follows
that the maximum velocities of galaxies are found in the outer reaches of the
observable Universe. This is logical: if all matter/energy was concentrated at a
singularity at the time of the Big Bang and then dispersed thereafter, those
manifestations of matter such as the galaxies that are farthest from the
observation point (for us, Earth) must have been traveling at the fastest
speeds. There is also another theory which
can, in principle, modify the implications of the observed redshifts, namely,
that the velocity of light is not constant but has changed over time by
gradually slowing down: this is the "tired light" concept which, while
intriguing, has so far not been supported by data or observational proofs,
although it does seem to have a relation to the expansion aspect of stretching
light to longer wavelengths (paragraph above). It has its supporters; some
cosmologists and quantum physicists have postulated that the current values of
certain fundamental parameters have changed with time, having different values
[especially in the early moments of the Big Bang] that evolve into their present
numbers as the Universe grew. Even though evidence for this is presently
lacking, this is not trivial or frivolous speculation but falls into the
time-honored scientific methodology of proposing seemingly outlandish theorems
or propositions capable of explaining some phenomena and then conducting
experiments to confirm or deny the idea.)
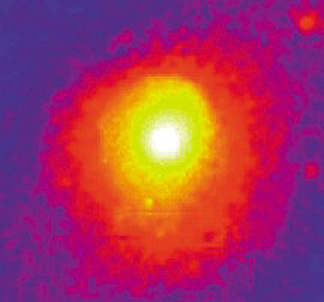
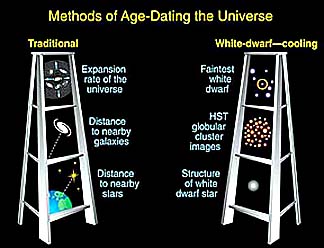
The age of the Universe is a
fundamental value which cosmologists seek with great care and effort to
establish accurately. What will help in settling on a "best value" would be an
independent measurement using a technique other than the recessional velocity
extrapolation. In April of 2002, a seemingly reliable second method has been
reported. It is based on knowledge of the time involved in white dwarf stars
burning out their remaining fuel to reach a "glowing ember" state. Theory sets a
fairly precise time span for this to occur. In the earliest stages of galaxy
formation, globular clusters will contain rapidly produced white dwarfs as large
stars burn their hydrogen over a brief time and then enter the dwarf stage. The
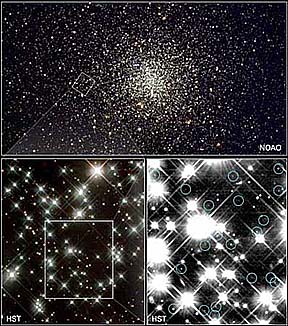
"embers" that are very old are hard to detect by telescopes. But, the Hubble ST
has been used on a globular cluster near the Milky Way to search for these
embers; by taking a long exposure image (8 days, spread over 67 days) these
faint white dwarfs were detected, as shown in this set of images of stars within
cluster M4:
As reported by Dr.Harvey Richer and
his colleagues, calculations place the age of these white dwarf "cinders" at
between 13 and 14 billion years. By adding ~1 b.y. (typical time for the first
globular clusters to develop) to these values, this independent age assessment
falls right within the same range now generally accepted from recession
measurements. The two methods of determining Universe age, using a "ladder"
approach to arrive at the final values, are shown schematically in this diagram:
Unless fatal flaws are discovered
in either or both methods, it seems now that an upper limit of 14 billion years
will stand as the actual age of our Universe.
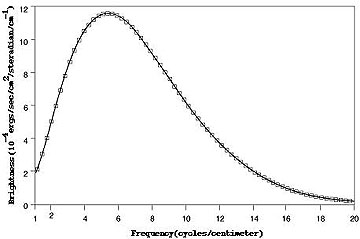
Another solid proof for the Big
Bang was the discovery that Cosmic Background Radiation (CBR) peaks near
the wavelength of 1 mm (1000 µm [micrometers]) which lies at the far
IR/microwave boundary region of the EM spectrum. This is the wavelength expected
from a radiant blackbody source whose temperature is now 2.72° K. George Gamow
and his colleagues had first predicted such radiation (their estimate of its
peak was at 5° K) in 1948. The CBR now evident as pervasive throughout space can
be traced to an equilibrium state between nucleons, electrons and photons that
was arrived at when the Universe had cooled to about 10 million °K at
approximately 6 months after the Big Bang. Evidence of what it was doing during
the Radiation Era, up to Decoupling, is lacking because of the opacity brought
about by scattering and internal entrapment of photons (see page 20-1) within the early
Universe during the next 300,000 years. At that time, as the temperature dropped
to about 4000 °K, almost all electrons (the principal scatterers) and protons
were able to combine as hydrogen atoms that no longer scattered the photons so
that light and other radiation emerged from the radiation "fog" which was fully
lifted by 1,000,000 years after the B.B. With the resultant transparent
Universe, CBR first became detectable, displaying the higher temperatures it
then possessed in the still early Universe. >From Decoupling to the present
time, the CBR has experienced a redshift of ~1200.
The photon radiation now being
measured is a manifestation of the present-day Cosmic Microwave Background
(CMB), inherited from the original radiation (much hotter and therefore then of
much shorter wavelengths in the infrared) released at the Big Bang. Astronomers
commonly refer to the CMB as the general residue of photons that were produced
and released during particle interactions in the first minute of the Universe -
colloquially, the CMB is the remnant of the "burst" of radiation that marked the
"explosion" of the Universe (but which really didn't explode in the sense of
detonation of a nuclear device in which there is an initial "flash" of light).
It is also referred to as the "afterglow" of the B.B. This radiation seems to be
very uniform and isotropic throughout the Universe. The vast majority of all
photons found in the present Universe are tied up in the background radiation.
However, despite their huge numbers, it is estimated that they comprise only
about 1/50000th of the mass contained in all the galaxies. The present ~3° K
value is consistent with a predictive model that requires very energetic high
temperature radiation (mainly gamma rays, with much shorter wavelengths) that
constituted the early CMB released soon after the Big Bang to cool drastically
by adiabatic (no energy added or removed) thermodynamic expansion
(a good Earth analog: expansion of an air mass is accompanied by release of heat
with resultant cooling) within a Universe having at the least the presently
observed spatial limits. Mechanistically, as space is stretched the original
short wavelength photons experience a corresponding lengthening of their
wavelengths into the microwave region and so lose energy (E = hc/λ) which in
turn is expressed as a much lower temperature. The extraction of a weak radio
telescope signal (after receiver noise was subtracted) in the microwave region
at 7.3 cm (4.1 GHz) was made in 1965 by R. Wilson and A. Penzias (for which they
received the Nobel Prize in Physics; actually, a similar signal was first
detected in 1961 by E. Ohm, then verified by B.Burke, but not connected to the
CBR prediction), with its correlation to cosmic background radiation then
confirmed by R. Dicke and his group at Princeton. This test, along with the work
by Hubble, the theory of General Relativity by Einstein, the pioneering concepts
of a primordial singularity by Lemaitre, the Inflationary Model by Guth, and
supporting contributions by numerous cosmologists, astronomers, physicists, and
mathematicians, taken together, make up the critical foundation concepts that
support and explain the Big Bang in its present form. Further discoveries will
likely lead to refinements but the fundamental concept and the proper numbers
predicted from the general model now seem to be solidly substantiated.
The value of satellites in this
refinement process is well illustrated by COBE (Cosmic Background Explorer),
launched in 1987 (check out its current Internet site).
Earlier attempts by Smoot and others to map the apparent non-variant (uniform)
background radiation over the entire sky using balloons and aircraft, to make
measurements above the atmosphere which blocks out (absorbs) radiation in the
.001 to 0.1 m region of the spectrum, gave strong hints of radiation uniformity
but were subject to imprecision. With COBE, the mapping process was greatly
improved so that a detailed chart covering the full sky was assembled in just a
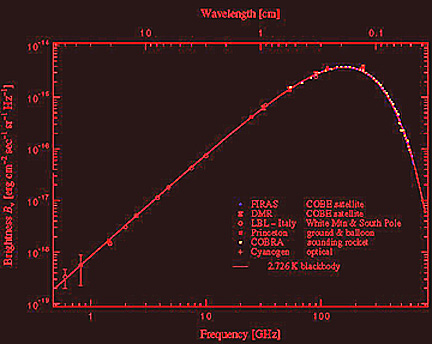
year. COBE verified the high degree of uniformity of the present background in
all directions and also confirmed that the general expansion is extremely
uniform in all directions. And, COBE took extremely accurate readings over much
of the wavelengths involved in the blackbody curve determined experimentally for
a 2.726° K body, demonstrating that the background radiation fits that curve at
better than 99% accuracy (an astounding achievement seldom attained in most
scientific measurements). These measurements were then combined with those
covering other wavelengths and obtained by different means to produce this
classic blackbody radiation curve (see page 9-2) in which the
COBE values were so accurate that error bars could be omitted (when the COBE
curve was first displayed to participants at an Astronomy conference, the
audience was moved to give a standing ovation; such an extraordinary curve with
all points precisely on the best fit version is the dream of all experimental
scientists).
A variant of this includes
measurements made by other CMR measuring experiments (different systems).
COBE also allowed the mapping of
radiation in the early stages of the Universe (specifically, at the close of the
Radiation Era some 300,000 (perhaps to 500,000) years after the Big Bang, when
the plasma in the expanding Universe had cooled sufficiently to become
transparent to photons) to an accuracy such that it showed variations in
temperature and density as slight as 1 part in 100000 during the first billion
years after time zero. It also established a range of +/- 200 microKelvins as
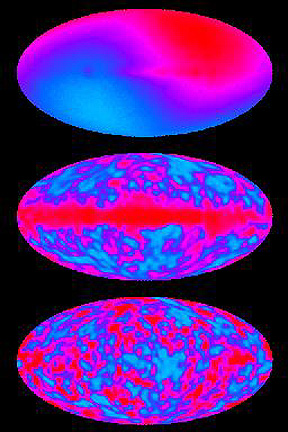
the range of fluctuations around the average CMR temperature. The maps below
show the broad distribution of these minute temperature differences across the
early Universe as detected by COBE's DMR (Differential Microwave Radiometer)
using data collected at 53 and 90 GHz. The blues represent slightly cooler and
reds slightly warmer temperatures - thus also define regions of greater and
lesser densities.
The top map is the "raw" data plot
in which the dipole effect caused by the Doppler motion of the Milky Way galaxy
has not been removed. The middle map results when the dipole effect is
eliminated, but the radiation from the Milky Way (central band) has not been
compensated for. The bottom map is the final product with both dipole and galaxy
effects removed - this is the one usually cited as the model for CMB
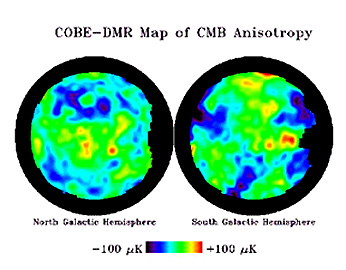
distribution. Another such plot, using different colors, recasts the
distribution in terms of the northern and southern hemispheres of the celestial
sphere:
These small differences were,
however, vital in allowing matter to break from the initial extreme uniformity
into regions of slightly cooler, denser conditions where the protogalaxies could
begin to form. Eventually, in the early Universe these seed fluctuations
promoted localized clotting of particles that became gravitational centers whose
growing attraction of more matter led ultimately to development of the billions
of galaxies that populate the Cosmos as we now know it.
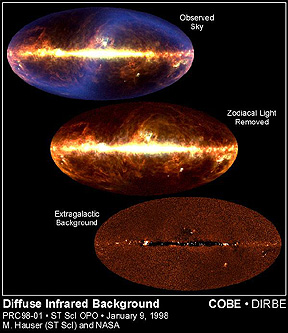
COBE has allowed an estimate of the
total energy in the Universe by sampling yet another part of the spectrum. This
results from painstaking analysis of radiation in the far infrared using the
Diffuse Infrared Background Experiment instrument onboard. This measures heating
of the dust distributed throughout the Universe, using windows at 140 and 240
µm. However, the overall background is "contaminated" by dust and other sources
within and around the Milky Way, the Earth's atmosphere, and other sources,
which require correction. The procedure is indicated in this figure:
The upper panel shows a sky map of
the infrared radiation for the whole Universe with a bright central band
representing the Milky Way contribution. The central projection is the change
after Zodiacal light is removed. The bottom panel is the residual infrared
radiation for the Universe after the Milky Way Galaxy's influence has been
removed. The net effect is that there is much more starlight in the Universe as
"fossil radiation" than heretofore suspected owing to the masking by dust
(ranging from near-Earth to intergalactic) whose influence is now accounted for
with this corrective DIRBE inventory.
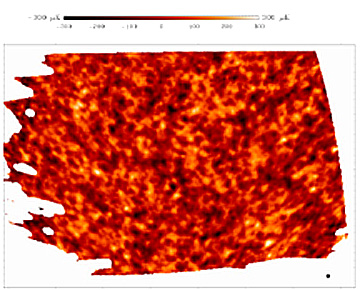
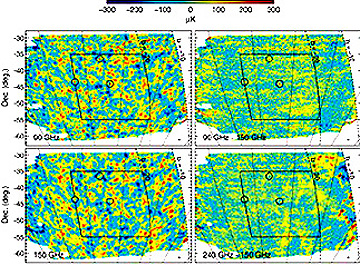
In April, 2000 a group of
scientists presented the results of project BOOMERANG (acronym for Balloon
Observations of Multimetric Extragalactic Radiation and Geophysics) One output
was a more detailed map of 3% of the sky which shows variations (with a 35x
improvement in resolution) in CBR at the end of the Radiation Era - which also
signals the beginning of the Decoupling Era marked by the recombination of
protons and electrons to form hydrogen atoms. This map was constructed by
measurements obtained with a passive microwave telescope suspended on a balloon
for 11 days at approximately 36400 meters (120,000 ft) above the Earth's
atmosphere over the Antarctic. The variations depicted are in units of
microKelvins.
Here are several more maps from
this experiment using radiation detected at different wavelengths. The upper and
lower left maps are at 90 and 150 MHz respectively; the two right maps are
differences between 90 - 150 (top) and 150 - 240 (bottom) MHz.
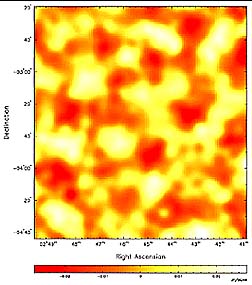
These results are confirmed, with
more detail, by the CBI (Cosmic Background Interferometry) experiment run
jointly by CalTech and the NSF. Thirteen 1 meter diameter dish antennae are
synchronized in an array with a broad baseline. This next figure is a map of the
background radiation over an area equivalent to about 2 widths of a full Moon.
The differences being measured are temperature values in microKelvins (µK) that
vary around the mean sky temperature of 2.73 K.
What is being sensed are small
temperature differences when the CBR was around 6000° K. Associated with these
differences are variations in material density. This observation supports the
idea that matter in the Universe at this early time was unevenly distributed,
thus allowing the first stages of density/gravity variations required to
initiate the galaxy formation process. The data displayed in these maps also
bear on the model that predicts the Universe had undergone a dramatic Inflation
in its initial moments, and in effect provide a positive test of that concept.
They likewise point to the notion of a flat Universe that will expand forever
(see below). A recent announcement from Hubble
scientists carries this cosmic background concept into the visible radiation
realm. Based on estimates of quasar populations at the farthest reaches of
observable space (the Deep Field region), extrapolations of visible light
sources to the entire Universe can be made. Results suggest that most of these
sources are now accounted for and that the total amount of visible light which
persists throughout the Universe is approximately of the order to be expected
(by calculation) from the same model that predicts the amount of Cosmic
Background Radiation. In other words, as different parts of the EM spectrum are
analyzed for total energy involved, the numbers remain consistent with
expectations and thus support the energy distribution predicted from the Big
Bang model. The overall notion of an expansion appears on firm ground
based on the ever accumulating scientific evidence. The results from COBE proved of
such import to understanding the early Universe, especially the small but
critical fluctuations it detected, that a more sophisticated satellite, MAP
(Microwave Anisotropy Probe), was launched in July of 2001. Background
information on this important new astronomical observatory can be found at NASA
Goddard's MAP site. (Another CBR
satellite, the Planck Surveyor, is planned for launch no earlier than 2005.)
The long-awaited preliminary
results from MAP were announced at a press conference on February 11, 2003.
Prior to that MAP was renamed WMAP, honoring the late David Wilkenson, a leader
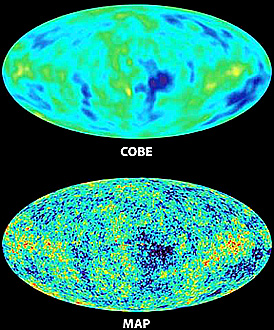
in the field. The higher resolution of WMAP, in
terms of ability to measure even smaller temperature variations, is evident by
comparing the new all-skies thermal map from WMAP with the equivalent coverage
by COBE:
This pair of plots clearly
demonstrates the great leap in resolution provided by WMAP, leading to much more
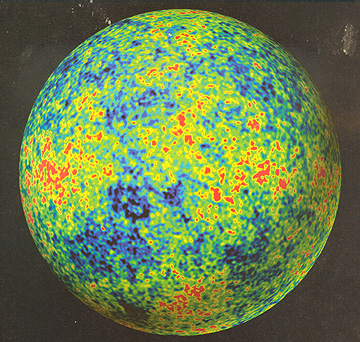
detail about the very slight but signficant variations in CBR temperatures. A
better view of the distribution of the very small but important black body
background temperatures is afforded in this projection of WMAP measurements that
describe conditions less than a half million years after the Big Bang; three
additional spherical maps are needed to cover the entire sky:
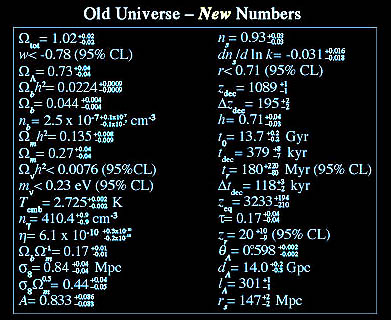
Some very far-reaching conclusions
about the Universe have been drawn from interpretations of the WMAP data. One is
a new (but still not necessarily the most accurate, although an accuracy of +/-
1% is claimed) age for the Universe of 13.7 billion years. Another is
strong confirmation of the reality of Inflation during the first fraction
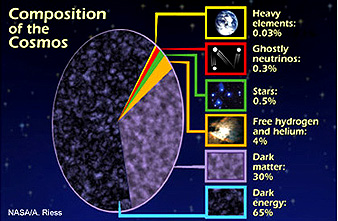
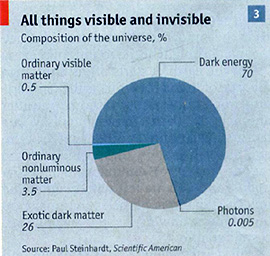
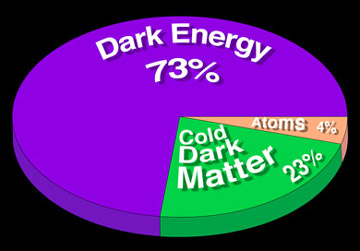
of a second after the Big Bang. The amount of detectable ordinary matter in
the Universe has been reset at 4% whereas dark matter is 23% and dark energy 73%
(but the results offer no clear indication of the nature of these dark
states). The time when the Universe first became transparent is now given
as 380000 years after the B.B. Indirect evidence from WMAP data suggest
that massive stars had begun to organize even earlier, perhaps at about
200,000 years post-Big Bang. Further evidence for accelerating expansion
is derivable from the data, leading to a firm conclusion that the flat
Universe should expand forever. Finally, many of the fundamental physics and
cosmological parameters have been refined, as shown in this table (without any
attempt by the writer to identify each).
(A CAUTION: A report issued in
November, 2003 presents some support for a very KEY topic of controversy in
Astrophysics and Cosmology: Have some or even all of the fundamental constants
been constant throughout the Universe's history? The speed of light is a
leading candidate for dispute and ingenious arguments indicating possible
variation. In the report, evidence is cited that the strength of the attraction
between nuclear protons and orbiting electrons may have been much greater in the
early days of the Universe. The role of quintessence (top of next page) is cited
as the factor responsible for this. Other constants are being challenged but
until incontrovertible proof is accepted, the "rule of thumb" is to stay with
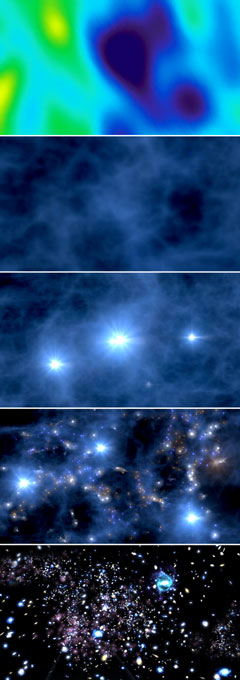
the values (subject to possible minor modifications) cited above.) Some of the recent ideas on the
start times for the first stars and galaxies received support and specificity
from the WMAP results. The first stars began to form as Supergiants about
200,000,000 million years ago. The first galaxies began to organize some three
hundred million (300,000,000) years later. This diagram depicts these stages
(from top): 1) initial stages of CBR variations; 2) clots of dark matter prior
to organization as stars; 3) the first supergiants; 4) developing galaxies; 5)
galaxies after the first billion years.
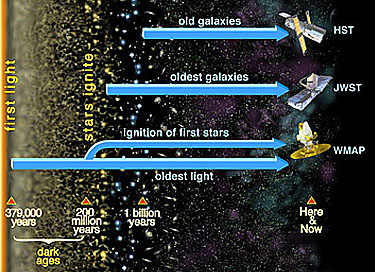
The time lines for the first stars
and galaxies as measured by different space telescopes (JWST is the James Webb
Space Telescope planned for 2010; its mission will focus on the early eons of
the galaxies, so that the starting time shown above is a "best estimate" for
now) are shown in this diagram. Of special import is the new estimate of when
the first stars started to form - about 200 million years after the Big
Bang.
Some cosmologists attending the
press conference went on record as believing the WMAP results will prove to be
the most important new data sets obtained from observations over the last
decade. A major future objective of WMAP
still to be addressed is to measure extremely small temperature fluctuations
that should support/confirm the existence of gravitational waves. These were
first postulated by Einstein as a consequence of his General Theory of
Relativity. Gravitational waves represent moving disturbances within
gravitational fields that are generated by various interactions of matter and/or
energy, such as collisions of black holes or neutron stars. With their force
particles, the gravitons, they are analogous to electromagnetic waves, with
their photons, except that gravitational waves can move unimpeded through matter
that itself interacts with photons by absorption. Like the graviton,
gravitational waves have yet to be detected but their behavior and influence
within the Universe can be simulated with computer-based models. As
gravitational waves move through space, they cause the geometry of space to
oscillate (stretching and squeezing it). The wavelength of a gravitational wave
depends on the mechanism of its generation.
Theory holds that gravitons and
gravitational waves must have first been created during the Inflation period
between 10-38 and 10-35 seconds at the outset of the Big
Bang. These waves participated in the extreme expansion during those moments and
as a result their wavelengths were greatly elongated. The inflationary
gravitational waves played a key role in bringing about the slight variations in
the distribution of matter and energy during the Radiation Era which ended in
the Decoupling Era at which time photons were no longer scattered - this latter
period is the earliest in which Cosmic Background Radiation could then be
detected. WMAP will seek to determine more exactly the temperature fluctuations
in the CBR field which correspond to the pertubations imposed by the
gravitational waves. In theory, these waves are detectable by analysis of the
CBR coming from the Cosmic Microwave Background; gravitational waves will cause
the radiation to be right or left polarized whereas density variations in the
CMB will induce radial polarization (the two modes of polarization must be
separated and distinguished by Fourier analysis.
Models of the Universe can be
classified in several ways: 1) Newtonian vs Relativistic; 2) with or without a
Big Bang, i.e, expanding vs steady state; and 3) for the Big Bang models, these
are either Standard or with a Cosmological Constant.
As a fundamental conclusion drawn
from the general acceptance of the Big Bang model for the Universe's origin and
development, the initial small space developed in the first minute has been
continuously enlarging - a process analogous to expanding in the manner
described on the previous page. However, the precise nature of this expansion,
still not fully known, depends on the specific expansion model, as we shall see
below. This is related to the amount of mass/energy available to control or
influenced the expansion. As we will see in the following paragraphs, proposed
geometries of the expanding Universe range from spherical to hyperbolic to flat.
The duration of expansion ranges from finite to infinite. The terms "open,
closed, flat" refer to certain constraints on the curvature of space and on its
expansion history. The type of Universe "shape" model
- open, closed, flat - is a factor in the change in the Hubble constant (and the
corresponding redshift) with time. A generalized relationship depending on
expansion models is shown in this next plot:
Before reviewing the various models
that were proposed in the 20th Century, we pause to briefly describe a useful
and (deceptively) simple view of the Universe embodied in the term Hubble
Sphere. This is based on the idea underlying the Hubble Length, which
is just the distance outward from Earth, as an arbitrary center
(remember, the Universe actually has no meaningful center), that has traveled in
1 Hubble time (tH = 1/H). In this framework, that distance is
represented as the farthest out we can look from Earth with our best telescopes
to see the first evidence of the Big Bang (which is not really possible owing to
the opacity soon after the B.B.); it is closely related to lookback time,
defined above. Consider the Hubble distance to be the radius r for a sphere that
encloses all of the Universe that we can presently see (this seems legitimate in
that currently the farthest galaxies [only a few found so far] all seem to be
about the same distance in light years from our observation point; these
distances are somewhat less that the outer limit that is defined by the current
value of H0). A simple way to visualize this sphere with its contents
is to imagine the points within (galaxies) such that the farthest away
(representing star systems in their earliest years are colored blue,
intermediate green, and closest (more advanced in development [but not
necessarily any older or younger than the blue group]) as red. The occupants of
the Hubble Sphere would thus show concentric color bands with blue closest to
the sphere boundary and red closest to the center. That boundary is, of course,
a time horizon and not an actual physical surface encompassing the
sphere. As we progress into the future and our instruments "see" still farther,
the apparent surface of the sphere moves outward with the increase in
rH. There are galaxies beyond the Hubble Sphere; they just haven't
been seen yet but will come into view later. Beyond the outermost galaxies,
assuming they occur at light year distances equivalent to that of a precisely
known Hubble Age, we cannot as of now specify "What's there". Using this simplified, rather
easily visualized model, let us take a moment to say a few things about the
size of the known Universe. It would seem to be determined by the Hubble
Distance (DH), which relates to the Hubble Age, around 14 billion
years. This is the distance out to the event horizon, the farthest out in
spacetime that we can see discrete particles or objects in the Universe (To
quantify the distance in Earth kilometers [or miles], just multiply the distance
that light travels in 14 billion years by the speed of light. Thus:
14,000,000,000 b.y. x 300 x 104 km/sec x 3600 sec/hour x 24/hrs/day x
365.4 days/year. For this case, the result, which I will call DH, is
1.3245 x 1024 km, or about 1.3245 septillion kilometers.) >From
the Hubble Sphere model, one might assume that the sphere has a diameter of 2 x
DH, particularly when one is aware that the event horizon is
essentially the same looking outward, say from the North Pole at the northern
celestial sphere and from the South Pole at the southern celestial sphere. But,
this is no so. In relativistic space expansion, the distances outward in
opposite directions from the Earth framework are not additive. This is due to
the fact that all point in the singularity that are now galaxies were next to
each other at the beginning and have simply drawn apart with the expansion of
space. With no meaningful center, we can only state for now that space has
expanded so much in 14 billion years. Euclidian size is not a valid way to look
at the Universe, whatever "shape" it may have, as implied from the paragraphs
further on this page. In trying to think about "size" there is a further
complication. The expansion during the Inflation period (see page 20-1) may have
proceeded at rates faster than the speed of light. If so, the Universe may
really be much bigger than what we deduce from event horizon distances. We get
our idea of distances only from measurements of z and H as determined from we
see now in the Universe after the galaxies formed. Prior to those times,
inflation expansion, yielding much greater z and H values, could have pushed the
outer edge of the Universe to distances well beyond what can be detected as
apparent event horizons. So, what can we say about our
understanding of the size of the (our) Universe. Its minimum size must be at
least as far out in spacetime as we can see galaxies, quasars, and supernovae -
13+ billion light years to the currently known event horizon. (We cannot [yet]
see timewise to anything before the Radiation Era; Cosmic Background Radiation,
which traces to about 300,000 years, is pervasive and thus not
location-specific.) The maximum conceivable size is infinity, with "outer
limits" reachable only in infinite time. If the Universe is indeed infinite, its
present outer limits are not fixed in any way, as they will enlarge forever in
their expansion towards infinity. If the Universe is proved to be finite
(contrary to the most likely scenario - see below), then its boundary is almost
certainly beyond the event horizon we now see - there are more galaxies farther
away which will become visible as time progresses and DH
lengthens. But thoughts on size are changing.
We can set a lower limit of the observable Universe at the currently most
favored age of 13.7 billion years. But we see that value in any direction we
look. Perhaps we are near the center of a finite Universe. If so, its radius
would about 27.4 billion years. But when the fact that the Universe is now
accelerating (as discussed on the next two pages), this must be taken into
account. Dr. Neil Comish and colleagues at Montana State University have done a
preliminary calculation on how much the Universe has expanded since the first
radiation around 13+ billion years was released and is now just being received
on Earth. But because the Universe has expanded at least a thousandfold since
the Big Bang, the distance that light has been traveling continues to increase
during the 13+ billion year timeframe. The source of the primordial light
leaving the very early Universe from any point (say, the first star), has thus
itself moved much farther than the time-travel distance. Their model leads to an
astounding number - 78 billion light years to the edge of todays Universe
and a possible diameter of a spherical Universe of 156 billion l.y. (so large
both because of the effects of spatial expansion and acceleration rates since
about 6 billion years ago). One might conclude that this requires different
values for the speed of light in the past, which might seem to violate the
General and Special Laws of Relativity, but the astronomers point out that this
speed remains constant but the distance a photon released at the beginning of
the Universe must travel is what is increasing. This estimated diameter and
other figures for size are obviously still controversial but the "true" size
should be increasingly refined in coming years. This mind-boggling conclusion
stumps the present writer (NMS) who cautions the reader to look out for the
inevitable scientific rebuttals. Nevertheless the reasoning is intriging. Now, to survey the major models for
the spacetime Universe:
Relativity has played a vital part in the models of the Universe that
remain the most plausible. The expansion of the Universe from a relativistic
framework can be summarized as the Friedmann equation. We give it here in
two forms, the first as a differential equation:Cosmic Ages
t (109 years) = 1/70 km/s/Mpc x 3.26 Mly/Mpc
X 106 ly/Mly X 9.46 x 10¹² km/ly X
1/3.15 x 107 s/year = 14.02 billion years
 Cosmic Background Radiation
Models for the Expanding Universe
And the second:
In these equations, Π (pi) is the
familiar constant (ratio of a circle's circumference to its diameter =
3.14159...), G is the universal Gravitational constant, ρ is a Greek letter
denoting the average density of the Universe, k is a curvature constant in which
values of 0, +1, -1 represent flat, spherical, and hyperbolic geometries
respectively, R is the Scale Factor for the observable Universe, H is the Hubble
Constant, c is the speed of light, and t is time. A solution to the Friedmann
equation depends on which Universe model is being tested, as the group described
next has different values for key parameters.
Several cosmological scenarios,
named after the scientist(s) who first proposed each (several scientists came up
with more than one model), for various modes of expansion lead to different end
results (shown graphically below for four general models).
In common, they all obey the
Cosmological Principle, which states that the Universe is both
homogeneous and isotropic (essentially the same average
distribution of matter/energy in all directions) on the largest scales
(this is not violated at the scale of galaxy clustering since at the universal
scale these tend to be "smoothed out" by having much the same patterns anywhere
one looks). Open models also must be consistent with the restriction placed by
the Second Law of Thermodynamics which from a cosmological standpoint states
that over time the entropy (a measure of disorder of a system) must
ultimately increase to (or towards) a maximum (total disorder); interpreted at a
universal scale this would lead to complete dispersal of galaxies and their
stars (perhaps rearranged as randomly distributed Black Holes) and blackbody
temperatures approaching zero. A corollary holds the initial singularity to have
minimum entropy which then rapidly increases during the first moments of the Big
Bang. Note that when the above curves are
extrapolated back in time, they strike the horizontal axis at different
positions (times). This means that the age of the Universe will vary relative to
the particular model being considered. Thus, although the current Hubble time
(1/H0, which depends on the accurate determination of the rate of
expansion) leads to an age or duration of the Universe, that value can be
modified when (and if) a particular expansion model is shown to be the best or
valid one.
The following table (modified from
Hawley and Holcomb, 1998) summarizes the principal Cosmological Models that have
been developed and tested by calculations. They fall into two groups: Non-Big
Bang (B.B.) and Big Bang. Another distinction category: Models in which the
Cosmological Constant L (see below) is a factor (upper five rows of table and
the Standard Friedmann (or Friedmann-LeMaitre) models in which L is not involved
(i.e., is O; bottom three rows); the three standard models also have
Deceleration Parameters q (defined below) that include the value 1/2 in some
way. 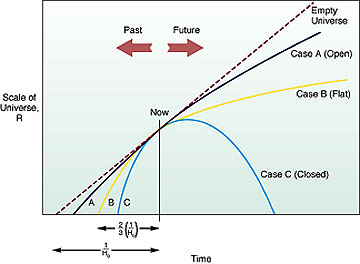
|
|
|
|
|
|
| de Sitter | Flat (0) | >0 | -1 | No B.B.; exponential expansion; empty |
| Steady State | Flat (0) | >0 | -1 | No B.B.; uniform expansion |
| Einstein | Spherical (+1) | Lc | 0 | Static; H = 0; now, gravity balanced by repulsive force; may be unstable |
| Lemaitre | Spherical (+1) | >Lc | <0 | Expand; hover; expand |
| Negative L | Any | <0 | >0 | Big Crunch |
| Closed | Spherical (+1) | 0 | >½ | Big Crunch |
| Einstein-de Sitter | Flat (0) | 0 | ½ | Expands forever; density at critical value |
| Open | Hyperbolic (-1) | 0 | 0<q<½ | Expands forever |
q = The Deceleration Parameter: denotes the rate of change with time of the Hubble Constant and R; a positive value indicates acceleration; negative = deceleration.
L = The Cosmological Constant,
introduced by Einstein to his field equations for General Relativity in order to
provide some constraint to gravity (a counter-effect) to avoid an inevitable
collapse of the Universe; if + (repulsive) L counteracts gravity; if -
(attractive) L augments gravity. Lc is one particular number known as
the critical value. L may be equivalent to the vacuum energy density associated
with particles at the quantum level. (L in texts is also given by a capital
Greek letter Λ). The current value for energy density within the observable
Universe is between 1 and 5 x 10-26 kilograms per cubic meter.
The Steady State, de Sitter, and
Einstein Universes, all non-standard, are currently not supported by
observational evidence. The more general diagram above
showing four alternative expansion models can now be redisplayed in terms of
some of the specific models described in the above table:
From J. Silk, The Big Bang, 2nd
Ed., © 1989. Reproduced by permission of W.H. Freeman Co., New York This next plot is a recent display
of the curves for various models in which the ordinate is the relative
brightness (luminosity) of galaxies used as data points. (The dark energy case
is discussed on the next page).
The nature and shape of the
Universe depends on its mass density (including energy forms that have mass).
The key parameter is the Critical Density, symbolized as ρc
(ρc = 3H3/πG). This is defined as just that total mass
that causes the Universe neither to expand forever nor to collapse on itself,
i.e., it is flat and will just stop expansion after infinite cosmic time has
elapsed. (As a practical measure it is estimated that, if all atomic matter -
both galactic and intergalactic - is redistributed to spread uniformly through
space, its density will average 10 atoms per cubic meter.)
There are three general shapes
available as options for the configuration and expansion of the Universe. Their
geometric characteristics are depicted in this next figure. Note that two
properties help to define the nature and behavior of each shape: 1) What happens
to so-called parallel lines in traversing the shape, and 2) What is the sum of
angles in any triangle drawn on the shape?
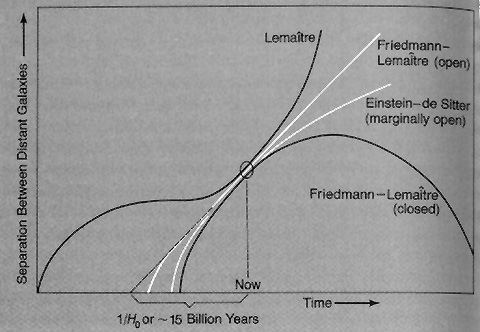
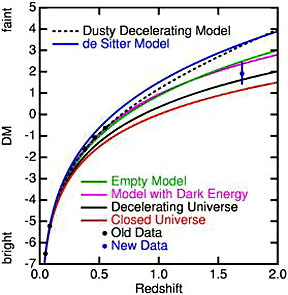
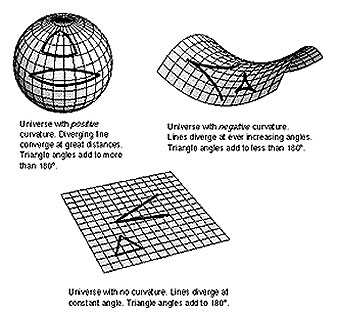
The spherical shape is said to have no boundary in that one would always remain on its surface and if "walking" along a great circle would always return to the starting point. It has positive curvature. Hyperbolic space is one that has negative curvature: although difficult to visualize, and best described mathematically, descriptively it has been likened to a horse's saddle; this geometry has the peculiar spatial attribute that movement away from the lowest point on it can go either "downhill" or "uphill", depending on direction. Flat space has minimal (zero) curvature and obeys the precepts of Euclidean geometry. In flat space, parallel lines remain parallel in this geometric sense; this provides a means to test the type of Universe geometry that corresponds to reality. This implies that light beams from a distant source do not converge or diverge. So far, evidence is that lines of radiation travelling in space remain parallel unless disturbed by gravity from massive bodies. Both flat and hyperbolic space can extend indefinitely (to infinity) in contrast to spherical space (but, in principle, if it expands continuously forever that too could lead to a kind of infinity).
These three general types of shape can also be depicted in space-time cone figures, such as this one, showing from left to right the steady, decelerating, and accelerating expansion models:
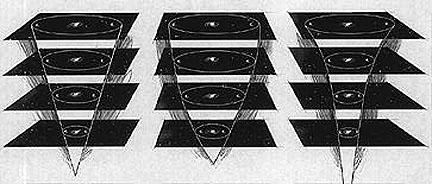
One theoretical way to distinguish which shape best describes that of the Universe: send two light beams oriented parallel to each other but separated by some distance. In the flat Universe, these beams will always remain parallel. In the hyperbolic Universe, the beams diverge; in the spherical Universe they will eventually converge and cross each other.
If the the total density (choosing
M as the sum of all matter and all energy; remember that energy can be stated in
terms of mass by Einstein's famed equation, restated: m = E/c2)
distributed throughout a finite Universe of some size or volume V is less than
the Critical Density, space is hyperbolic and open; if greater than
critical, spherical and closed; and if equal to critical, space is
flat (at least at the scales we observe it). This can also be expressed
as the Density Parameter or Ω which is the ratio of the actual
densities ρ of matter and energy present in the Universe to ρc, the
density that would apply to a Flat Universe expanding to infinity; the Open,
Flat, and Closed Universes are associated with Ω >, =, and < 1
respectively.
Considering all of these models :
If the Universe is open or flat, the Universe will expand infinitely but at
different rates depending on the parameters associated with each model. The
closed and negative L models, in contrast, predict finite expansion followed by
eventual contraction and thus at some time the Universe returns to a singularity
state. For each of the models, the expansion geometry and the behavior from the
onset (the Steady State model has no "beginning") to its eventual fate (Crunch;
Expansion) depends ultimately on the matter density that characterizes it. The first five models are all
non-standard and were devised when Einstein's Cosmological Constant seemed to
have some essential validity (abandoned,by Einstein and the cosmological
community in the 1930s but now reinstated; a good review of the present status
of the Constant is found at this University of Chicago
site). Each of these models fits at least some of the general
observations of the Universe but failed on other accounts. Einstein himself
spent many years in calculating properties of such Universes but eventually
abandoned the concept of a counter-gravity force, admitting it was his "biggest
mistake" in his scientific reasoning. Evidence for this Constant is still
lacking but in recent years variations of it are again becoming fashionable to
explain some of the phenomena essential to a changing Universe, as we shall see
on the next page which dwells upon an Accerating Universe. Its possible
equivalence to the concept of vacuum energy density may have been a key factor
in the Inflationary Stage of the early Universe; a rapid increase in L (the
Lambda-force) could be the driver behind the tremendous expansion then but that
increase had to be short-lived and L must revert towards zero or the Universe
would have long since "blown" away.
The Einstein Universe is a static
one, with spherical geometry, developed by this great scientist as an attempt to
apply General Relativity to Cosmology. The idea of the Big Bang had not yet
captured the attention of cosmo-scientists. In order to keep the Universe
"going" instead of collapsing under its own gravity, Einstein invented his
Cosmological Constant L to balance the attractive forces. While now considered
notably incorrect, this type of steady state model stimulated others to propose
variants that incorporate expansion. The de Sitter Universe is a strange one,
being empty and never undergoing a Big Bang. Its value of q being negative (-q)
denotes an accelerating Universe. But in working back towards time zero, its
representative R(t) value never attains zero, which means that it has no
beginning, i.e., has an infinite past. While theoretically interesting, the
model defies most observational parameters. The Steady State Universe was
formulated by Hoyle and others as an "antidote" to the Big Bang model. It
accepts expansion and implies that the Universe has no beginning or end. In
order to preserve the matter density distribution determined for the Universe,
Steady State requires a "creation field" in which new matter (mass) must be
continuously created through time to balance the rate of expansion. Another
model (not in above Table) also does not start with a Big Bang; this, the
Eddington-Lemaitre model, is closed and finite and is static initially but
thereafter starts expanding when the galaxies begin to form by hydrogen gas
condensation.
The Lemaitre model, derived from
the Big Bang concepts, begins with a rapid increase in R during the early
Universe but then experiences an extended period when R(t) remains nearly
constant (owing to the effect of L being greater than Lc) so that
expansion is minimal ("hovers") until much later resuming at an accelerated rate
(read the modern version of this resumption of acceleration on the next page).
The Abbe George Lemaitre (a Catholic priest from Belgium who also was a
physicist) was the first to consider the starting state to be one of extremely
high (approaching infinity) density (he called the singularity a "primeval
atom"; Gamow applied the Greek word "ylem" [primitive matter] to everything
contained in such a singularity).
Among the three standard
hot (high temperature) Big Bang models, the Open Universe model (also
known as the Friedmann-Lemaitre model) predicts that expansion continues forever
at an essentially constant rate through an infinite and unbounded space based on
hyperbolic geometry (in which light can follow both positive and negative
curvature simultaneously). Evidence so far suggests that a (nearly) flat
Universe model, whose density is at the critical density (Ω = 1, the condition
that there is just enough matter distributed throughout the Universe to cause it
to expand forever even as it endlessly slows down) accounts for many of its
observed properties, so that the Einstein-DeSitter Universe is currently
the model most widely held to approximate reality. This model is in accord with
current estimates for the age of the Universe.
(The mental picture one gets from
the word "Flat" as we have been applying it to cosmic expansion may be somewhat
illusory: one meaning - just as the surface of a large balloon may appear flat
to an ant at some point on it, so the Universe may in fact be spherical but acts
as though flat within the region open to our direct observation (we experience
this on Earth as our local surroundings appear flat out to the horizon but would
show its real curvature if we were orbiting astronauts). However, flat on a
Universe scale may mean just that - flat in our experiential Euclidian sense -
imagine a table top that keeps expanding forever from within itself (not just by
growth at the edges) in two primary directions; points at different parts of
this infinitely growing top would all separate from each other. Table tops do
have a third dimension [thickness], as presumably does a flat Universe, but
expansion in that dimension may be finite.)
Closed Universes
follow spherical geometries. The prime model shows greater rates of expansion in
early cosmic time (this is not the same as the incredible but brief expansion
almost at the very beginning of the Universe if inflation indeed is a real
phenomenon) with decreasing rates of augmentation thereafter. Thus, the
components of the Universe move outward powered in part by the inertia imparted
by the energy release at the Big Bang. However, the mass/energy level is high
enough for gravity to effectively pull on galaxies, stars, and other matter so
as to gradually slow the expansion to a zero rate. Thereafter, the condition
becomes one of increasing deceleration. The rate of separation between galaxies
diminishes with time until, at some future time, expansion ceases and galaxies
then draw closer at ever faster rates until all matter and radiation converge to
a singularity (perhaps 50 b.y. in the future), undergoing what has been called
the Big Crunch.
This raises the
possibility of Repeated Universes, as singularities explode, expand,
ultimately contract to the next singularity, and then repeat the cycle
indefinitely, or, even infinitely; however, this scenario seemingly would
violate the entropy restriction in that the singularity should have a minimum
rather than maximum state of disorder that is the outcome for every model.
Multiple Universes (next page) that evolve simultaneously are a possible
consequence of the Chaotic Inflationary model which in recent years has
gained favor as a variant of the inflationary version of the Big Bang; these
Universes, however, have no likelihood of contact with one another, so that
their existences may be unprovable.
To sum up this topic - the shape of
the Universe. Evidence is building that the Flat condition is the most likely to
describe this configuration. Results from COBE and WMAP seem to offer solid
support for this view. Consider this diagram:
The closest fit of size variations
of cosmic background radiation fluctuations, as determined by calculations, to
the observed COBE and WMAP data is that of a Flat Universe.
Nevertheless, whether
the present Universe is open, closed or flat is still being debated, despite the
ever-stronger support for a Flat Universe. The key factor is the mass density of
the Universe. If this amount lies below a critical value, then gravitational
forces will be insufficient to finally halt the expansion that would eventually
result in all matter throughout space being pulled back into closure; in the
open case, expansion is forever in (apparently) the one and only Universe. As of
now, inventories of mass within the Universe have come up way short of the
amount actually identified as to their nature needed to maintain a closed
Universe but with further observation and experimentation the gap is narrowing.
If the interpretation of WMAP data is essentially "on target", then the
condition that the total Universe mass is close to the Critical Mass allows for
a fairly precise estimate of how much mass must be found and accounted for.
The bulk of the missing mass (and
energy particles that have mass) is believed to exist as dark
(non-luminous, i.e., does not give off [detectable] electromagnetic radiation)
matter of still uncertain types and/or as neutrinos, and thus remains at present
"invisible" to astronomers detectors. Theory presently holds that most proposed
kinds of Dark Matter do not interact with baryonic (Ordinary) matter, although
some Dark Matter may be baryonic. Dark matter is currently difficult to detect
and thus count quantitatively. Dark energy, a closely related topic, is
mentioned briefly in this subsection but will be examined in some detail on the
next page.
As will be discussed below, some of
the dark matter seems to associate with the galaxies. But a computer simulation
reported in late 2003 indicates the bulk of dark matter occurs in large "clumps"
distributed throughout intergalactic space. Black holes may serve as collectors
of this dark matter. A recent estimate states outright
that the several kinds of dark matter, and dark energy, together comprise ~95%
of the Universe's mass, with varieties of normal matter accounting for the
remaining less than 5%. This means that most of the matter in the Universe
presently is invisible to detection so far on Earth (the billions of
luminous galaxies, each with billions of stars therefore make up only a tiny
fraction of the Universe's total mass).
This humongous amount of
dark matter is postulated by inferences drawn from observed effects; indirect
evidence comes from the behavior of galaxies and galactic clusters which seem to
need this superabundance of mass to account for their stabilities and motions.
For example, the velocities of stars in outer galactic spiral arms is much
greater than predicted from the Newtonian 1/r2 force law, implying
excess external mass. Thus a sheath of invisible dark matter/energy acts to
prevent galaxies of spinning apart by holding the fast-moving outer starts in a
gravitational bind.
Another line of evidence comes from
the gravitational lens effect - much more mass than observable is needed to
account for the degree of bending of space as predicted by General Relativity.
This is revealed by a greater curving of light from more distant light sources
(therefore displaying larger displacements than expected) than would be caused
only by the mass of the specific galactic cluster whose gravitational influence
is being tested. Another sign of concentrations of hidden mass relates to
directional movement of galaxies near enough to observe and measure this motion.
Close to home, our Local Group (including the Milky Way) of galaxies is moving
through space in the direction of the Constellation Centaurus at greater than
expected velocities, under the influence of an invisible mass concentration
dubbed "The Great Attractor."(by itself, the Milky Way is moving at about 2.1
million km/hr towards the region around the Constellation Leo). Also, huge
masses of glowing gas whose molecules are rapidly moving and hence indicate very
high temperatures have been detected; being very hot, they should fly apart but
clearly are holding together, indicating the attractive action of great
quantities of invisible mass.
There is evidence that
older, more primitive stars (that have a paucity of those elements that were
produced in stars and dispersed by supernova explosions) contain around them
higher concentrations of dark matter. But, much (most?) of the missing mass may
be tied up in Black Holes; billions probably exist throughout the Universe, and
many, if not most, of the galaxies have Black Holes in their central cores. A
Black Hole, with immense mass and a size estimated to be more than 2.5 million
Sun diameters has been verified at the center of the Milky Way, around which the
inner stars revolve about the Hole at speeds up to 3 million km/hr as they
spiral inward to eventually be sucked in (by comparison, the Sun orbits around
the galactic center at ~790,000 km/hr and the Earth around the Sun at ~108,000
km/hr).
The composition of dark
matter is still speculative. Candidates are shown in these diagrams, modified
from that which appears in the page dealing with the nature of the Dark Universe
found on the University
of Oregon Astronomy site we have referenced several times in this Section:
Some of the baryonic dark matter
occurs in what is called MACHOs (for MAssively Compact Halo
Objects), consisting of baryons (protons, neutrons) and other matter
(probably some fraction of the neutrinos pervading space) in the non-radiating
dark halos now known to distribute around galaxies and in intergalactic space
(see below). In the halos they constitute most of the faster moving Hot Dark
Matter (HDM). MACHOs provide enough extra mass to provide the gravitational
boost that holds galaxies together (motion in the spiral disk would otherwise
cause a galaxy to fly apart). Dwarf galaxies and white and black dwarf stellar
remnants - too small for ready detection in more distant space - may also abound
in this material. Black Holes, Neutron stars, and Dwarfs, undetectable by visual
means but identified by their gravitational effects on nearby visible stars,
also make major contributions. In fact, the same (as yet undetected) material as
occurs in MACHO's may also make up planet-sized black holes, whose numbers in
the Universe can be huge; this is not yet verifiable if a B.H. is "standing
alone", i.e., does not have a companion star(s) feeding it material that becomes
excited and luminous.
One MACHO type is the neutrino
whose existence has now been proved. Once thought to be massless, a tiny but
real neutrino mass has only recently been verified - a determination that could
account for much (most?) of the "missing" Universe mass. Neutrinos (electrically
neutral) are found not only in haloes but appear to pervade the "empty space" of
the Universe. An announcement in June 1998 by a Japanese-American research team
may dramatically change the role of neutrinos in the mass balance sheet. Using a
deeply buried detector and a huge array of detectors, they have been able to
capture light signals set off by neutrinos that disclose these extremely small
particles to have an infinitesimally minute mass, about one ten-millionth
that of the electron. But, because of the extremely large population of
neutrinos throughout the Universe (like the Cosmic Background Radiation, they
too are a residue of the Big Bang, being especially produced in abundance during
the first few minutes when protons were being fused into deuterium and helum
nucleii releasing energy as neutrinos), the cumulative mass of these particles
may make a sizeable contribution to the inventory of missing mass. But other
theoretic MACHO(s) that remain to be discovered (either from future particle
accelerator experiments or from still-to-be-built, more sensitive space
detectors) constitute the bulk of the MACHO population. Concerning neutrinos as a component
of Dark Matter, until recently there was still considerable uncertainty as to
whether neutrinos (there are several varieties) have any mass at all. They
rarely interact with matter and are thus very hard to detect. At this instant,
billions of neutrinos are passing through your body, and perhaps one or two at
most will meet with an atom. Experiments in several countries are attempting to
find out more aboutthe elusive neutrino. Below is one example of an experimental
detection setup. Several thousand feet below the surface, in a large alcove in a
nickel mine near Sudbury, Ontario (the overlying rock screens out most other
high energy particles that might produce false signals), is a 12 meter diameter
sphere containing heavy water (deuterium instead of hydrogen). Around it are a
bevy of event detectors. A few events have been ascertained, but the number of
solar neutrinos appears lower than theory had predicted.
If the neutrinos are finally
assigned a specific (but tiny) mass, they must be a major component of dark
matter. The estimated ratio of dark matter neutrinos to ordinary matter is
100,000,000 to 1. Despite miniscule mass, the total from so many neutrino
particles would make a sizeable contribution to the total (still unaccounted for
as specific components) mass of the Universe. A significant fraction (perhaps the
bulk) of the missing matter, however, seems to occur in Cold Dark Matter (CDM),
probably in the form of slow-moving WIMPs (Weakly Interacting
Massive Particles) - elusive matter/energy that does not interact
with electromagnetic (EM) or strong nuclear forces. These appear to be heavy
nonbaryonic particles (50 to 100 times the mass of a proton) of still unknown
nature. They may also include two specific particles that have been postulated
but not yet found experimentally: the neutralinos and the axions -
both predicted to exist according SuperSymmetry theory. Several high energy
accelerators are either now operational or are being built (the best and biggest
is CERN's Large Hadron Collider [LHC] in Switzerland) to find direct evidence of
the existence of WIMPs or some similar form of matter. Recent reports from several
investigator teams claim that much of the dark matter is accounted for by the
very hot gases that are believed to pervade the intergalactic space that appears
"empty" compared with galaxies and nebular clusters of visible gases. A clue to
the presence of these gases (undetected at visible and longer wavelengths) was
found in UV spectrum data but the signal was weak. However, when Chandra data
for x-ray radiation was collected from intergalactic regions, indications were
for very hot gases in signficant concentrations in the so-called void. An
estimate of gas densities was obtained by calculating the weakening of certain
wavelengths as radiation from a gas-rich region passes through a nebular mass.
This is shown diagramatically:
The relative amounts of matter and
energy (which can be expressed as matter using the E = mc2
conversion) have been calculated based on data collected in the past few years.
This is conveniently displayed in this pie-chart diagram, made in the mid-1990s:
A similar diagram, made a few years
later, shows a slightly different composition, owing in part to selection of
different categories of the physical components of the Universe:
In this diagram, Ordinary visible
"matter", mainly in the galaxies, amounts to only 0.5%. Photon radiation moving
about the Universe contributes just 0.005%. The MACHOS make up the Ordinary
nonluminous matter (3.5%) and WIMPS comprise the Exotic Gark matter(26%). The
bulk of the ingredients in the Universe is what is known as "Dark Energy", and
accounts for ~65% of the estimated total mass/energy; conjectures as to its
nature are described on the next page in the paragraphs that deal with the
repulsive energy that could relate to Einstein's Cosmological Constant.
The WMAP data have resulted in a
further refinement in the percentages of dark matter and dark energy. This
diagram shows a shift to a 3% larger amount of dark energy with a corresponding
decrease in dark matter:
In February 2003, F. Nicastro and
his associates at the Center for Astrophysics of Harvard's Smithsonian
Astronomical Observatory reported a more precise calculation of the numbers for
Ordinary matter. Of the 4% that comprises the total amount, about 0.4% is
luminous (in the visible range) as the stars making up galaxies. The remainder
consists of H, He, and other baryons that occupy both galactic halos and beyond
in intergalactic space. These exist in a high temperature (105 to
107 degrees Kelvin) "fog" that they have detected using both FUSE
(Far Ultraviolet Spectrometer Explorer and Chandra (x-ray) data. This fog is
left over from the galactic formation process and serves to provide the extra
mass needed to gravitationally bind together galactic groups (they studied the
Local Group around the Milky Way) in clusters. The roles of Dark Matter and Dark
Energy in the observed Universe are still being worked out. Both, or perhaps
Dark Matter in particular, seem to be needed to keep the galaxies intact and to
prevent them from collapsing into each other. It appears that the gravitational
forces from the matter within a galaxy are insufficient to keep them from flying
apart and dissipating into intergalactic space. Dark Matter should provide the
mass needed to furnish the gravitational stability that maintains the integrity
of the galaxies once formed. In fact, several models for its existence and
nature consider the bulk of Dark Matter to occupy large invisible halos
surrounding the galaxies, serving as the major gravitational "glue" that holds
them together. An imaginative explanation for why
dark matter (in terms of mass) has so far eluded scientists as to proving its
existence and nature has been proffered by Dr. Jonathan Feng and his group at
the Univesity of California-Irvine. They postulate this matter to be hidden
particles that reside in an extra dimension beyond the three spatial ones that
we sense. This is plausible if the multi-dimensional space described at the
bottom of page 20-1 is a
reality. This model may be provable by this means: the extra-dimensional mass
particles would tend to collect around bodies that have strong gravitational
pulls. Under this influence, the particles would tend to collide with each other
more often, producing neutrinos with especially high energy. Experiments to test
this hypothesis around the Sun have been proposed. One test for the existence of Dark
Matter (Energy) is that of the (Einstein) gravitational lensing effect (bending
of light as it passes by a massive galaxy). If only the luminous matter in the
galaxy, supplemented by assumed mass in contained black holes, is operative, the
amount of deflection should be less than observed. In fact, that deflection is
greater than this simpler case, and thus has been attributed to at least MACHOS
and/or some amount of WIMPS that are emplaced in and around the galaxy. Using
gravitational lensing techniques, the size of the dark matter distribution
concentrated around galaxies has been estimated to be in a roughly spherical
arrangement up to about 5 times the radius of each galaxy examined so far. Incontrovertible proof that Dark
Matter and Dark Energy really exist, and insights into their nature, rank near
the top of priorities that astronomers and cosmologists intend to address in the
first decade of the 21st Century. A number of approaches besides gravitational
lensing have been proposed. One is to compare the size of a galaxy as seen in
visible light to the size of its associated hot matter (the "fog") that gives
off strong x-ray radiation. Look at this pair of images of a galaxy in the Virgo
galactic cluster:
Another, oft-cited, example is the
NGC 2300 galaxy group, consisting of a number of individual galaxies as seen in
visble light that do not show up as individuals when x-radiation (measured by
ROSAT) is assigned colors to indicate its extent.
How do these x-ray images indicate
the presence (existence) of Dark Matter? The argument is that the galaxies would
have flown apart by now but are held together by the mass associated with the
dark matter that encloses them. Consult the University
of Oregon page cited above for illustrations that define this process. A
further generalization: Dark matter surrounds all galaxies and serves to keep
them intact. In effect, it provides the added gravitational influence that
maintains galactic coherence (the stars, dust, and gases alone would be
insufficient to prevent the galaxies from flying apart). A variant to the size argument is
to study the shapes of galaxies that have characteristics explainable by the
presence of dark matter. MGC 720, some 80 million light years away, shows
differences between visible and x-ray images that can be postulated as imposed
by dark matter in the halo surrounding the galaxy. As seen below, the galaxy has
a flattened elliptical shape when viewed in visible light but as imaged by the
Chandra X-ray Telescope the core appears round and the surrounding excited
matter is distributed spherically. A calculated model for this difference works
well when a concentration of dark matter is introduced. There is a hypothesis
that galaxies will attract greater amounts of dark matter surrounding them than
would be found in intergalactic space.
In June, 2003 another report of on
the action of dark matter gave a strong indication of just how much mass is
involved. Below is a Chandra view of the galaxy cluster Abell 2029, located
about 1 billion light years from Earth. This x-ray image shows a central
radiating mass (an elliptical supergalaxy that resulted from merger of many
galaxies) and a huge cloud of glowing hot gas that is interpreted as under
direct control of this dark matter, which is estimated to be equivalent to a
hundred trillion times the mass of the Sun.
A few of the galaxies within Abell
2029 are depicted in this visible light image made by the Palomar 48-inch
Schmidt telescope. In July of 2003 another image was
released which may actually show the dark matter as a faint glow (blue)
pervading a cluster of galaxies:
To obtain this image, the HST was
trained for a total of 120 hour of light-collection time on the cluster CL0024
which presently is some 4.5 billion light years away. Spread through the
galactic group is the uniform glow which in itself has not been identified as to
nature. But its distribution (map) is much as expected for dark matter based on
theory. If this glow indeed is really dark matter, then it produces some
luminosity, i.e., emits EM radiation that is normally so weak as to be
undetected in shorter exposures of visible wavelength observations from both
space and Earth telescopes. Recently, studies of dark matter in
the ultraviolet suggest that one of its constituents appears to be ionized
hydrogen which does not produce a detectable signal from the myriads of hydrogen
clouds now known to populate galactic haloes and intergalactic space. But,
chemical processes in these clouds produce ionized oxygen, uncombined with the
invisible ionized hydrogen, which can be detected. This form of oxygen is
widespread in much of space beyond the galaxies and, together, with the ionized
hydrogen may account for a significant fraction of the daark matter. Another potential approach to
studying dark matter, including an attempt to prove its existence within the
Universe (rather than just a fleeting existence during collider experiments on
Earth), is now underway is the installation of a 2.8 meter telescope, called the
South Pole Telescope, located close to that point in the Southern Hemisphere. It
will be capable of measuring small changes in conditions (primarily
temperatures) around galaxy clusters; these changes would verify expected
variations caused by dark matter/energy as predicted by models now being
developed. An interesting alternative to Dark
Matter as the stabilizing force is that of a concept called MOND, for Modified
Newtonian Dynamics. This is reviewed by its originator, Dr. Mordecai Milgrom of
the Weizmann Institute in Israel, in his article "Does Dark Matter Really
Exist?" in the August 2002 issue of Scientific American or the October 2003
issue of Discover Magazine. Check this to be familiarized with its essentials.
His ideas are derived from observations that such spacecraft as Pioneer 10, now
8 billion miles from Earth, are slowing down (the expectation would be for
increasing velocities as the Sun's gravity weakens with distance). This would
seem to imply that solar gravity is actually increasing as the distance
lengthens. In a nutshell, he postulates a constant of acceleration, called
a0, that determines the gravitational behavior of matter.
Acceleration values larger than a0 are consistent with the Newtonian
Second Law in which F (force) = m (mass) time a (acceleration such as we
observe experimentally for gravitational processes or for imposed accelerations
[e.g., a rocket launch]). (Recall in the Preface that Newton's Second Law works
well on Earth and in the Solar System but is not accurate when galactic scales
are involved.) But in his proposal values smaller than a0 modify the
behavior of galaxies, including the rates at which they rotate, in a way that
obviates the need for dark matter gravity. Using his non-Newtonian approach, his
mathematical analysis of galaxy dynamics based on values of a's that are
less than a0 reproduces most of the observed effects in the orbital
patterns and rates of motion of stars within galaxies. He has tentatively
determined that a0 decreases the Newtonian proportionality by one
10-billionth of a meter per second per second. This, rather than Dark Matter,
causes stars in a galaxy to move faster than expected. His model, initially
disregarded by most cosmologists, is now attracting serious attention. Some of the ideas introduced on
this and the preceding page are examined in a different manner, based partly on
the information provided by the Cosmic Microwave Background Radiation, on this
Internet page
prepared by astronomers at the University of California, Santa Barbara. (It is
rather technical.) Two other reviews on cosmic expansion and Einstein's
Cosmological Constant, prepared by Sten Odenwald for the Raytheon Corp., are
found at (1) and (2). A good review of
Dark Matter and Dark Energy appears in a Science News Web
article. An excellent, clearly written
article by Martin Rees and Priyamvada Nataranjan, entitled A Field Guide to
the Invisible Universe appears in the December, 2003 issue of Discover
Magazine Much remains to be tested and
learned about Dark Matter. In mid-2004, a view gaining acceptance is that most
of the Dark Matter is composed of WIMPS and tends to be concentrated in and
around galaxies, as integral parts of galactic halos. Dark Matter must also be
considered as closely entwined with Dark Energy - the two affecting and
controlling each other since the Big Bang but in changing proportions of
influence.
So, now on to Dark Energy per
se, which comprises the bulk of the entities that make up the Universe. *The steeper sloped H case represents a
Universe that is more rapidly expanding, has covered less distance, and is
younger (10 billion years); the slope for H = 50 has expanded more slowly over a
longer time (20 billion years) but has covered a greater distance (bigger
Universe).
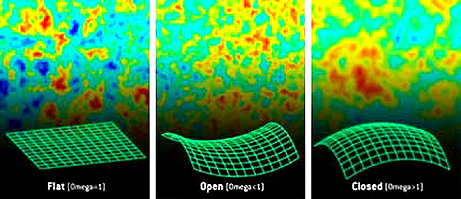
The "Missing" Mass in the Universe